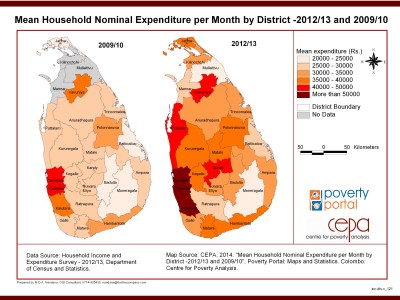
Mean Household Nominal Expenditure per Month by District - 2009/10 and 2012/13
This map shows the nominal expenditure per month of an average household by District between the year 2009-2010 and 2012-2013.
District | View More »
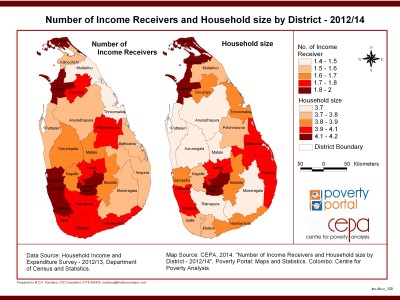
Number of Income Receivers and Household size by District - 2012/13
This map shows the number of income receivers and the size of households by District between the year 2012-2013.
District | View More »
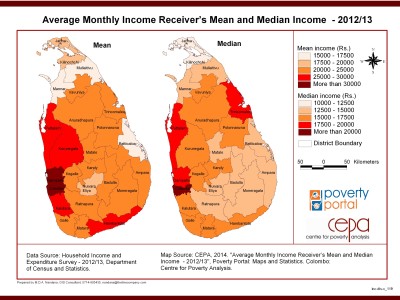
Average Monthly Income Receive Mean and Median Income - 2012/13
This map shows the mean and median of an average monthly income receiver by District between the year 2012-2013.
English | View More »
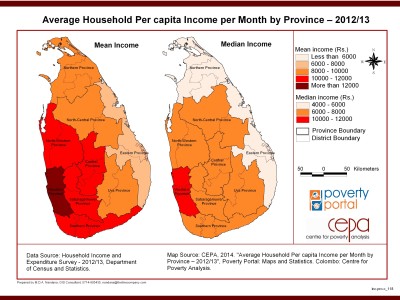
Average Household Per capita Income per Month by Province-2012/13
This map shows the mean and median of an average household per capita income of Sri Lanka per month by Province between the year 2012-2013.
Province | View More »
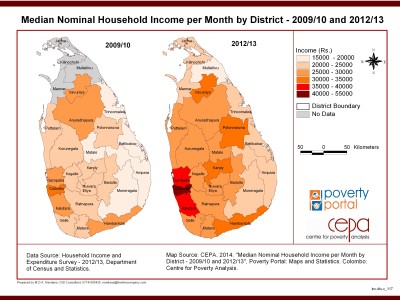
Median Nominal Household Income per Month by District - 2009/10 and 2012/13
This map shows the median nominal household income per month by District between the year 2009-2010 and 2012-2013
District | View More »
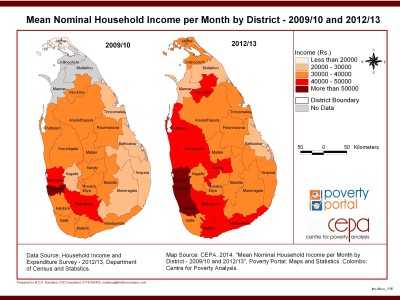
Mean Nominal Household Income per Month by District - 2009/10 and 2012/13
This map shows the mean nominal household income per month by District between the year 2009-2010 and 2013-2014.
District | View More »
District | View More »
District | View More »
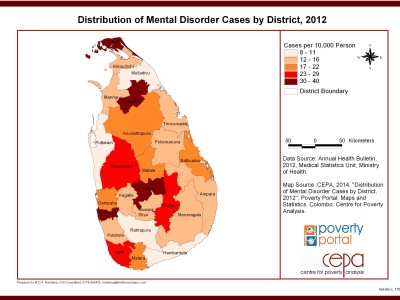
Distribution of Mental Disorder Cases by District, 2012
This map shows the distributionof mental disorder by District in the year of 2012.
District | View More »
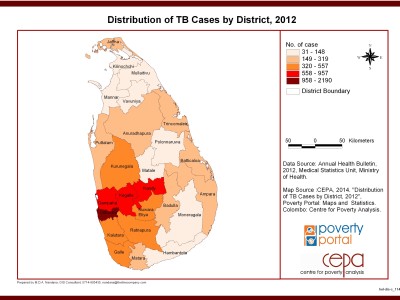
Distribution of TB Cases by District, 2012
This map shows the spread of TB by District in the year of 2012.
District | View More »
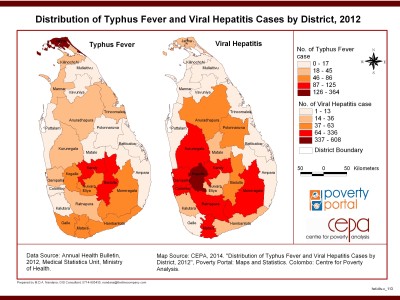
Distribution of Typhus Fever and Viral Hepatitis Cases by District, 2012
This map shows the distribution of Typhus fever and Viral Hepatitis by District in the year of 2012.
District | View More »
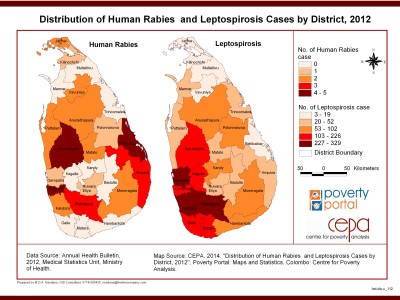
Distribution of Human Rabies and Leptospirosis Cases by District, 2012
This map shows the distribution of human rabies and Leptospirosis by District in the year of 2012.
District | View More »
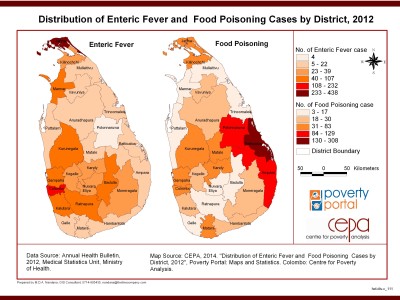
Distribution of Enteric Fever and Food Poisoning Cases by District, 2012
This map shows the spread of Enteric fever and Food poisoning by District in the year of 2012.
District | View More »

